We no longer support this browser. Using a supported browser will provide a better experience.
Please update your browser.
Small businesses can make substantial contributions to the economic growth and dynamism of the places where they operate. However, small businesses are also often affected by the characteristics of the communities in which they operate. Communities with more resources can create a favorable ecosystem for small businesses to thrive, while communities with fewer resources may have less economic activity. Within metro areas, communities vary widely in economic and social characteristics that could create different experiences for the small businesses that operate in them. Understanding the nature of this variation and its effect on small businesses is critical to the development of policies that promote small business success.
This report aims to inform differences in financial outcomes in the small business sector across communities in the largest metro areas of the United States. In doing so, it provides a granular view of differences in the performance of small businesses by two key indicators: profit margin and cash buffer days. It also analyzes the impact of socioeconomic conditions of a community on small business financial performance. The report aims to inform the specific challenges of communities within cities, as well as contribute to a wider understanding of the community characteristics behind the success of small businesses in urban America.
Finding 1: In the typical community, 29 percent of small businesses were unprofitable, and 47 percent had two weeks or less of cash liquidity.
Finding 2: Nearly 70 percent of communities where small businesses had limited cash liquidity in 2013 also had small businesses with limited cash liquidity in 2017.
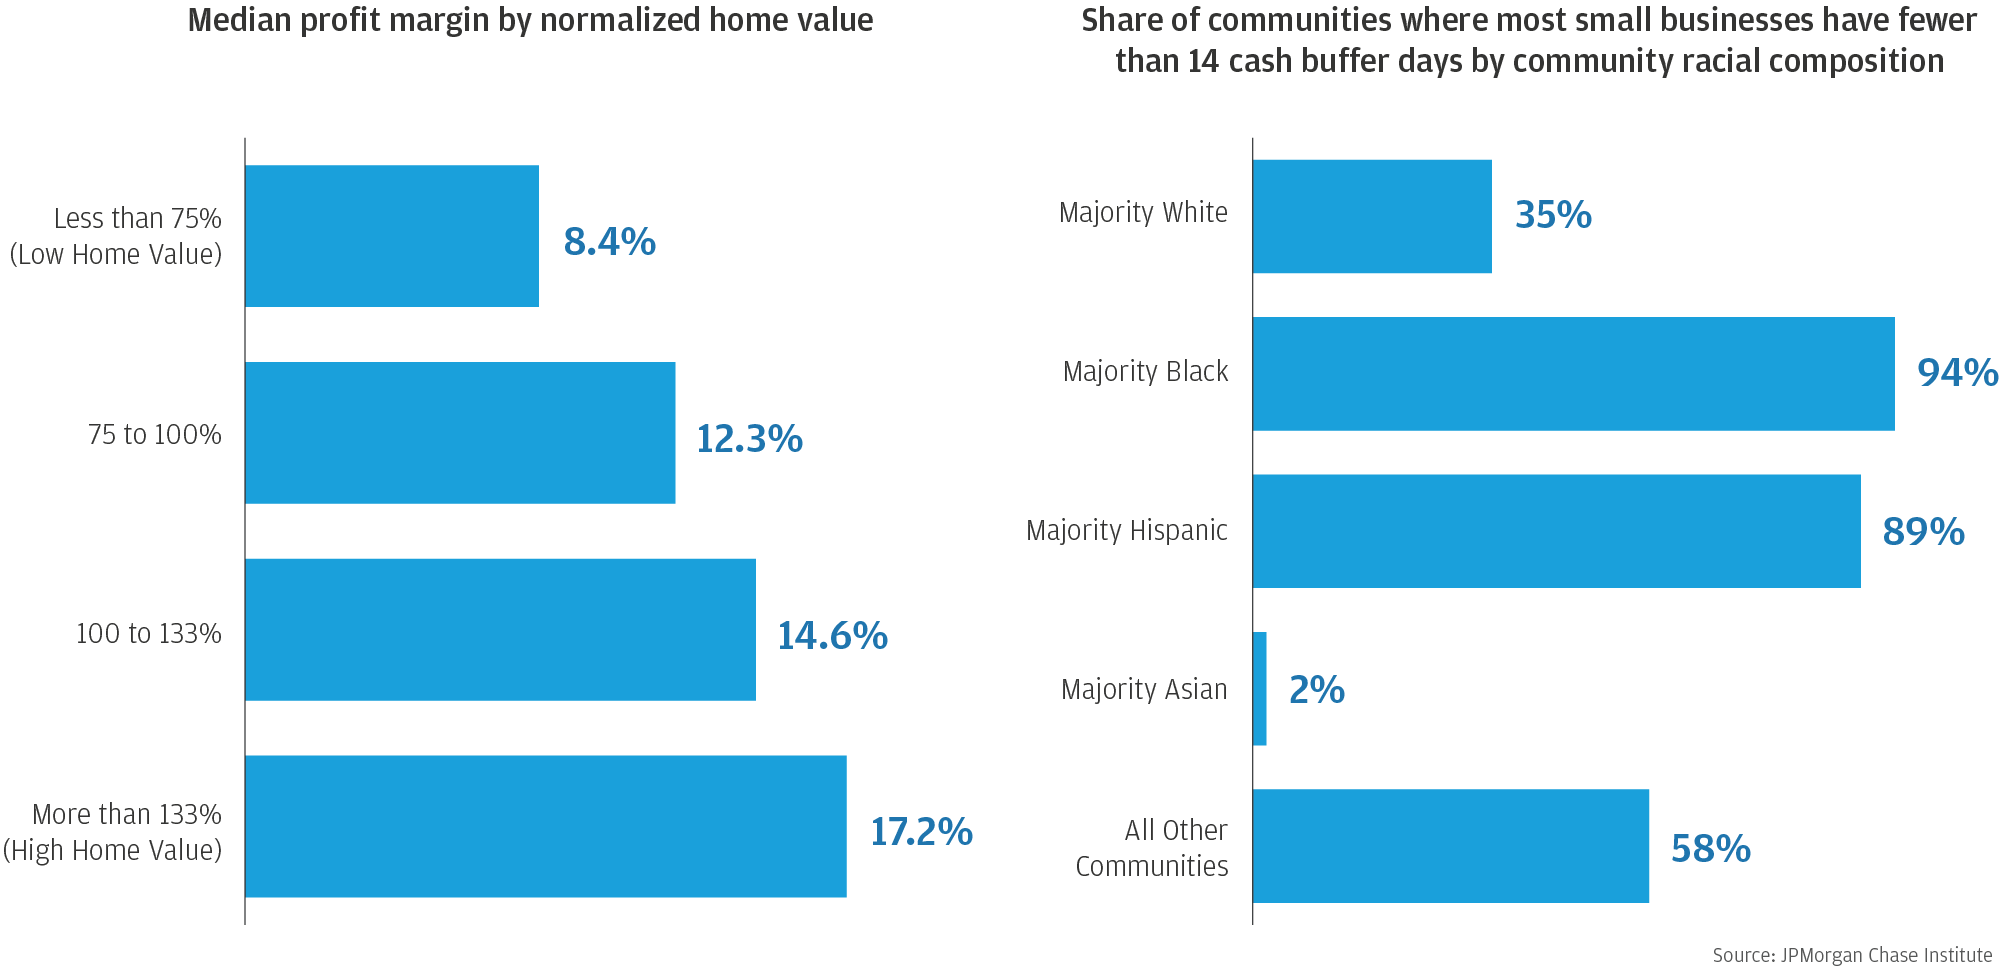
Finding 3: Small businesses in low home value communities had seven fewer cash buffer days than those in high home value communities. However, they had similar exit rates.
Finding 4: Profit margins for small businesses in communities with few college graduates were over 10 percentage points lower than those in communities with many college graduates.
Finding 5: In all majority Black or Hispanic communities, most small businesses had fewer than twenty-one cash buffer days.
Finding 6: Communities where small businesses had limited profits and cash liquidity rarely had large high-tech or other professional firms, but often had large retail or health care services firms.
These findings suggest that the socioeconomic and industry composition of a community have a meaningful impact on the financial health of small businesses and their ability to contribute to broad-based economic growth.
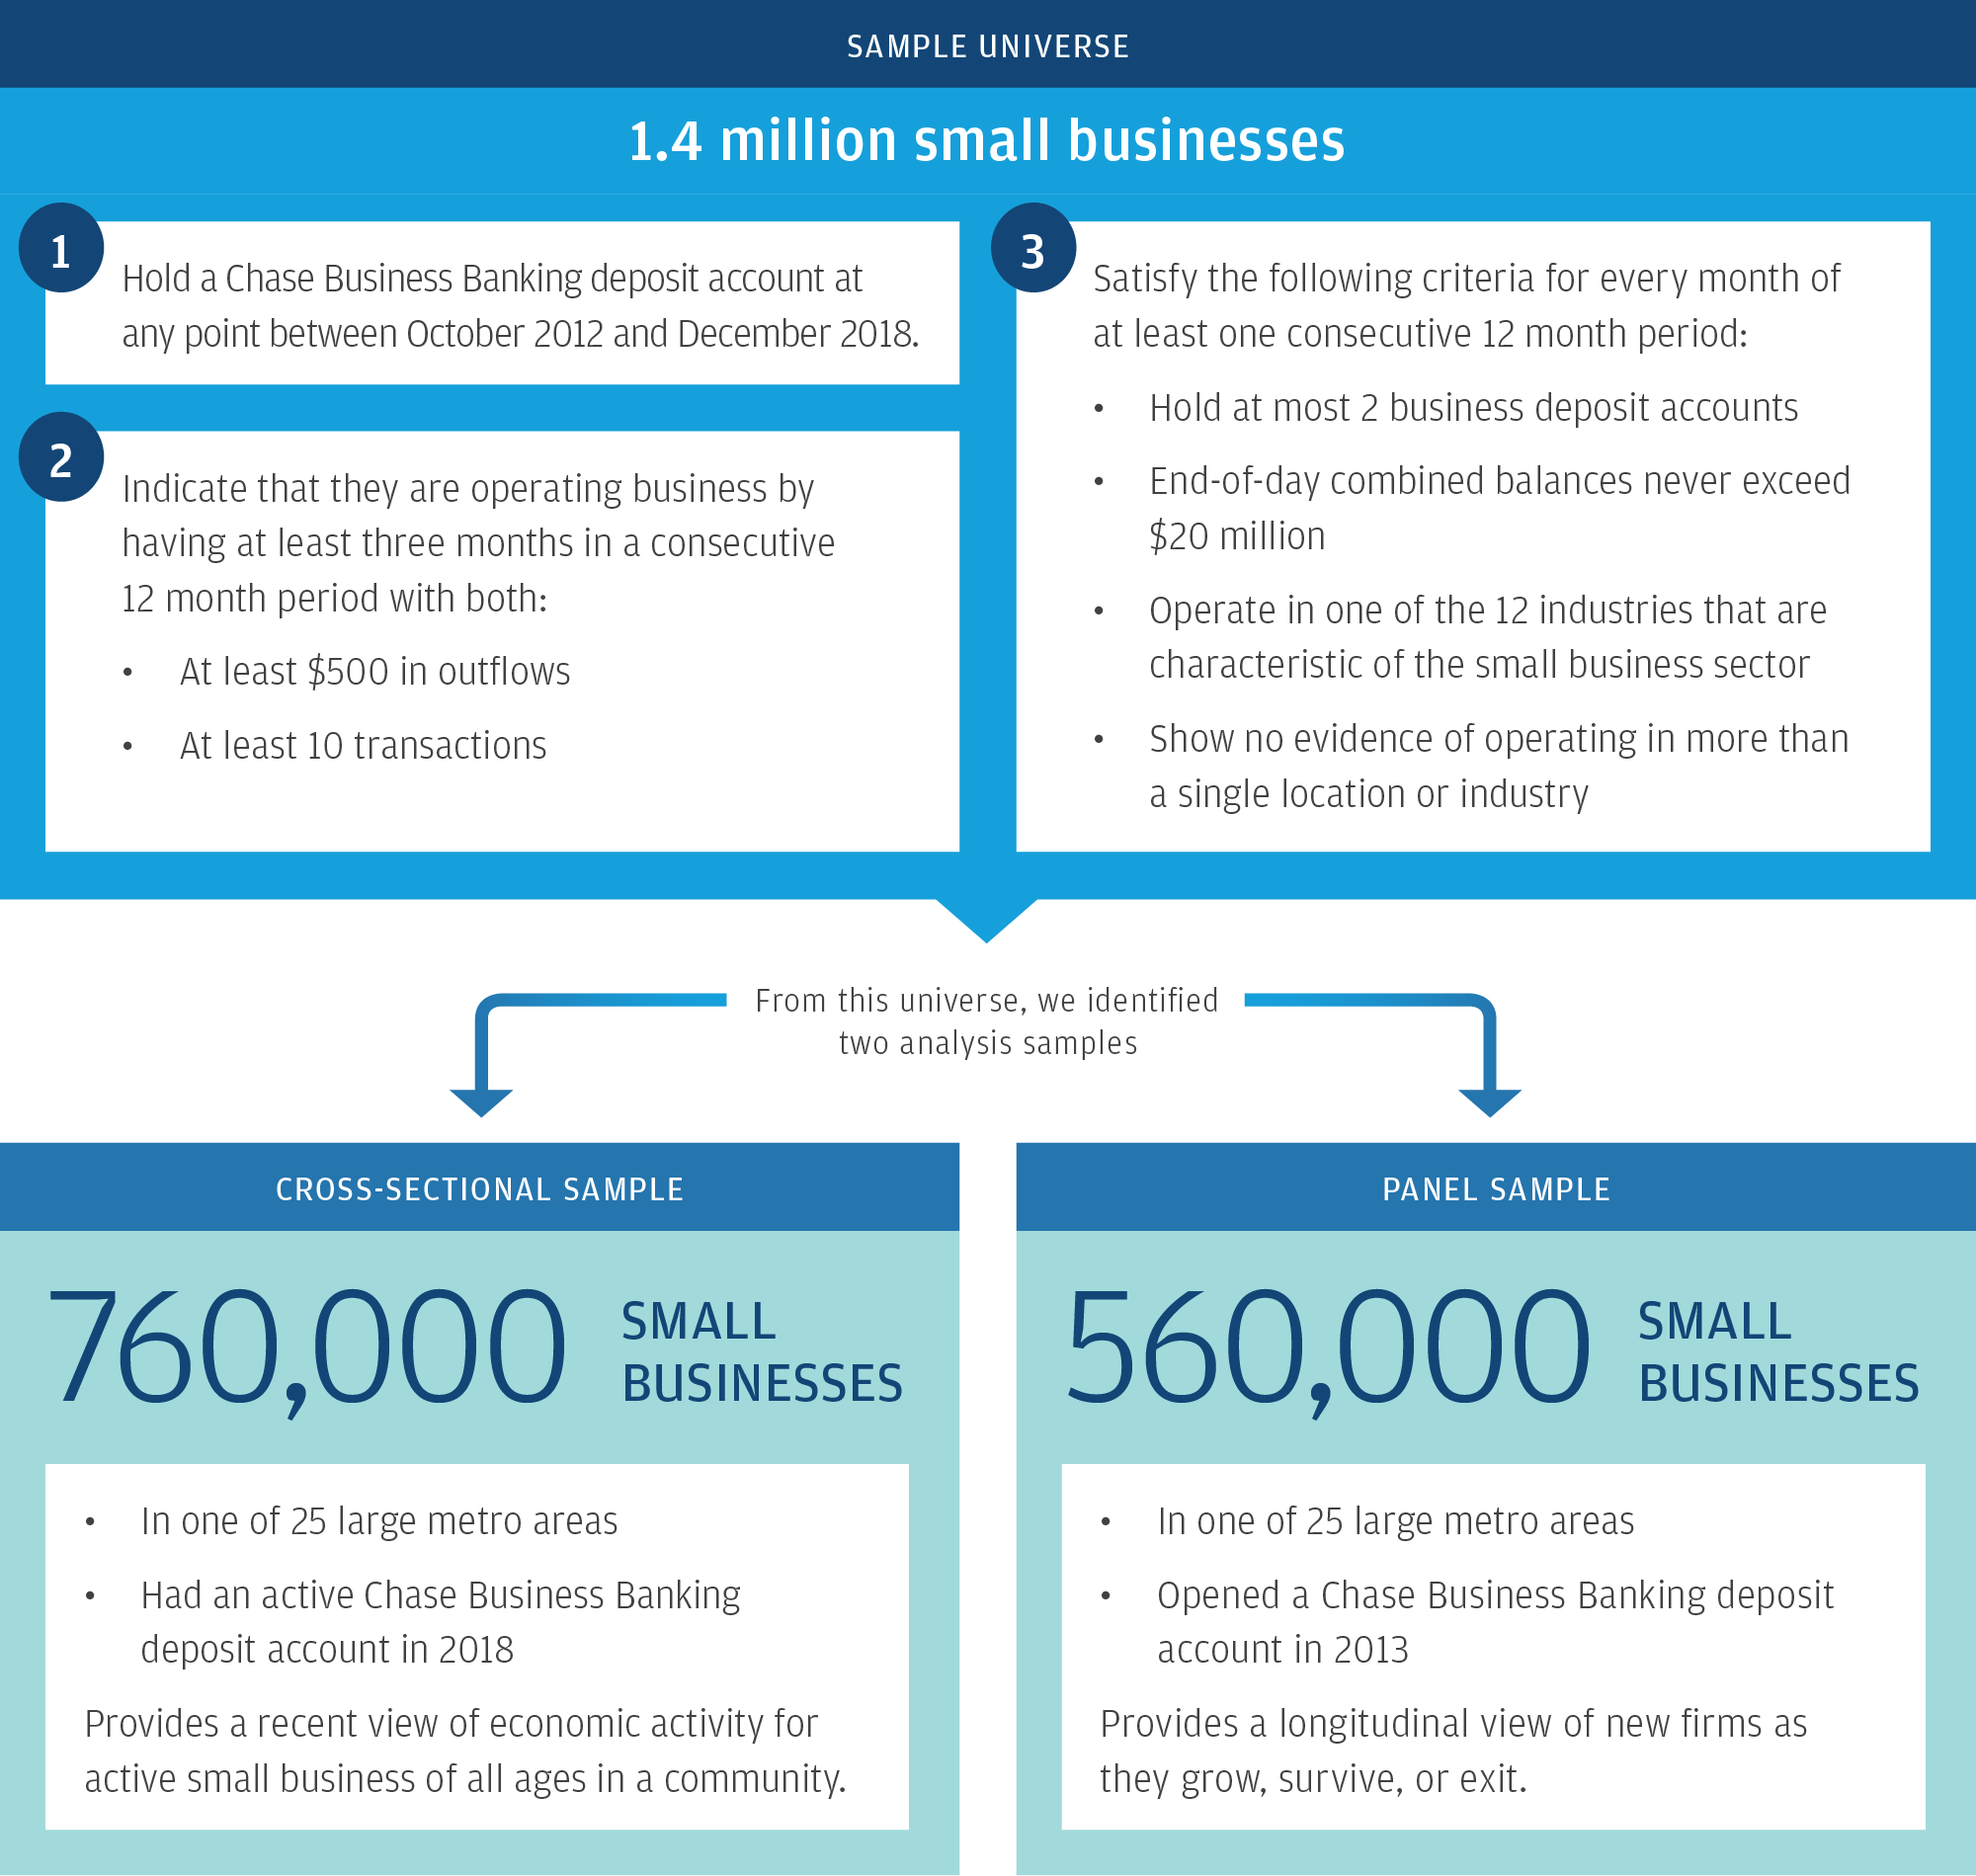
This report leverages two samples to generate insights—a panel sample of small businesses of any age active in 2013, and a cross-sectional sample of businesses operating in 2018.
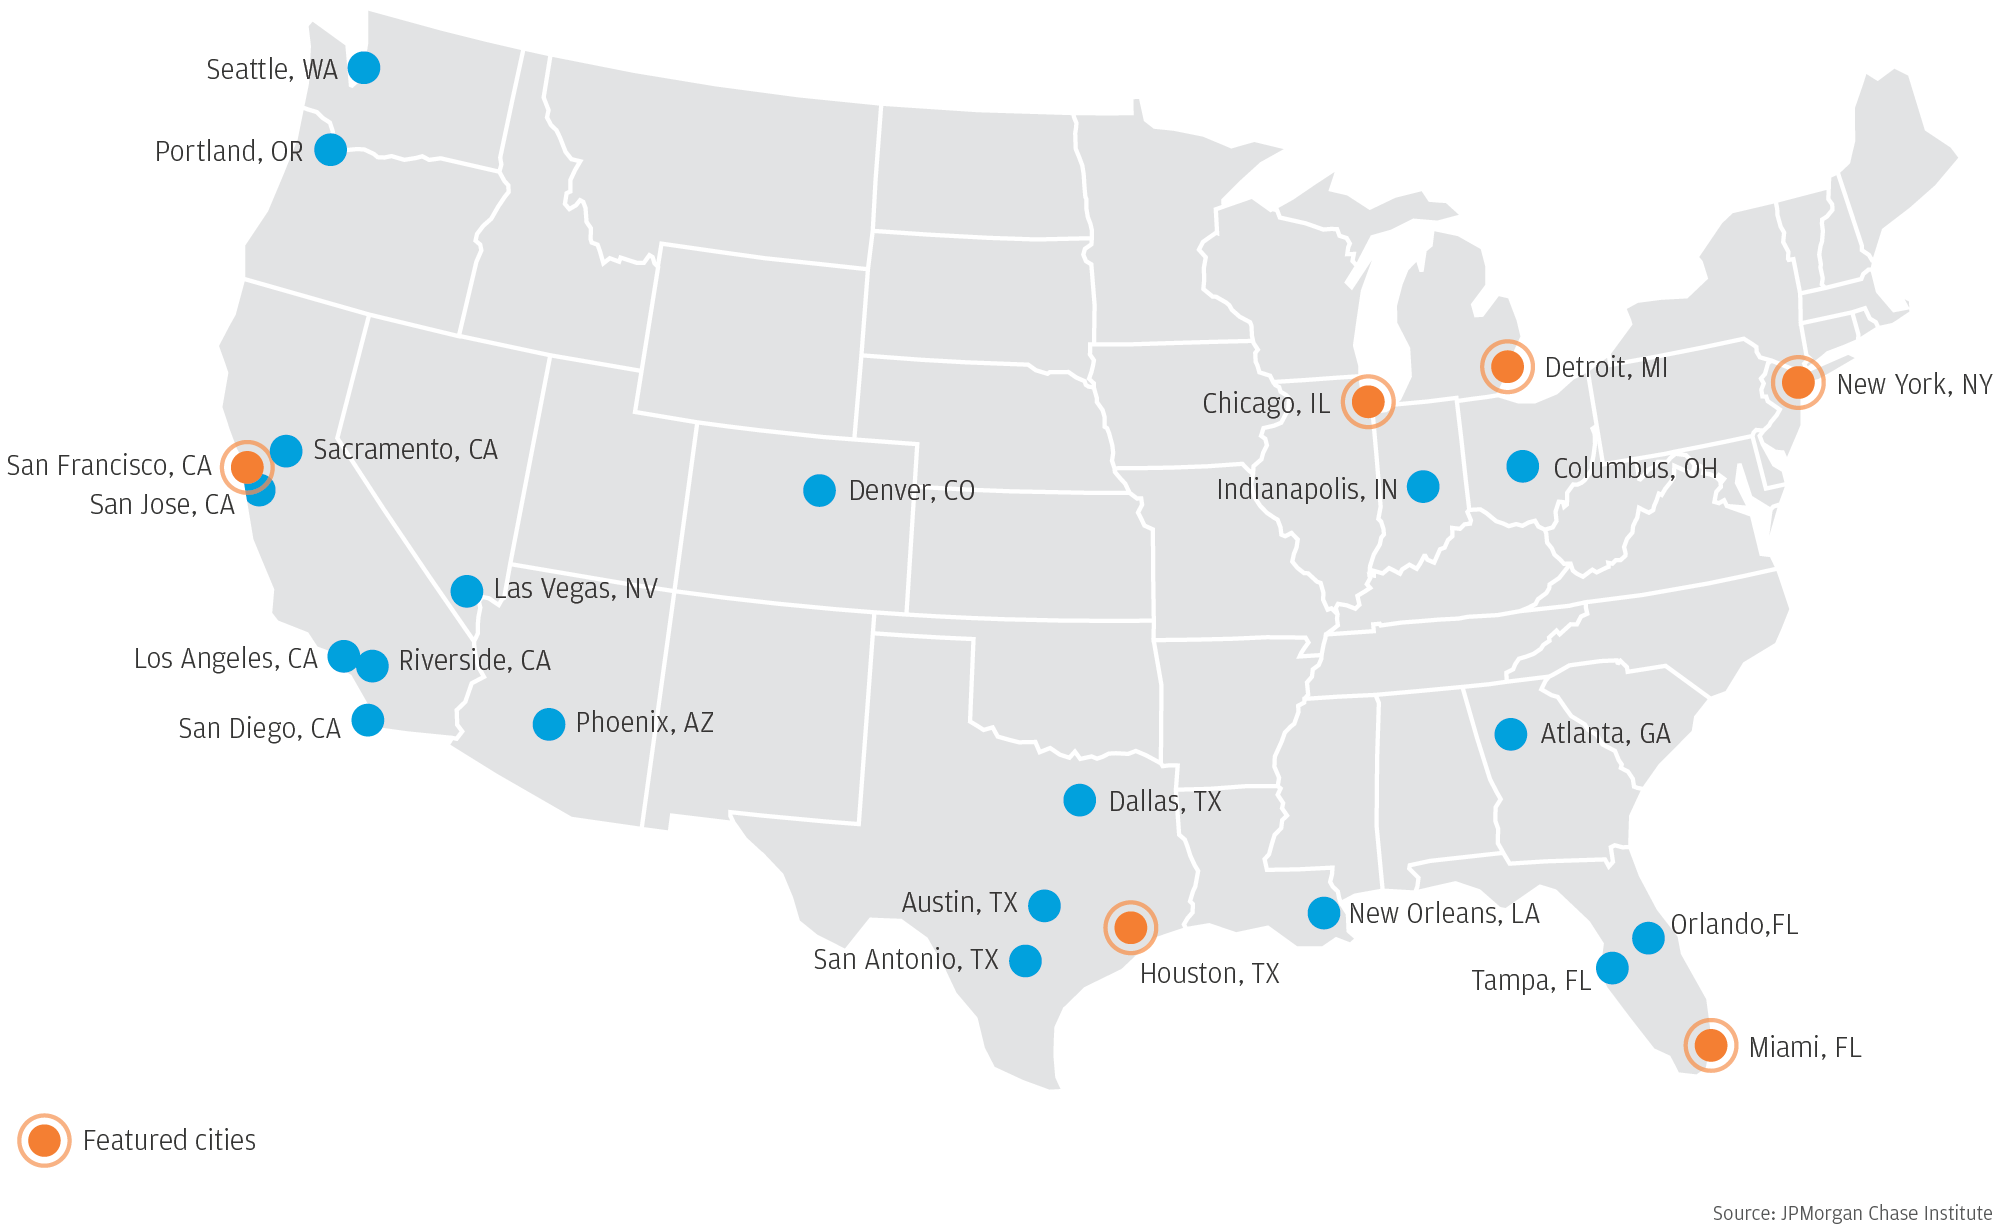
The panel sample consists of 560,000 firms that have Chase Business Banking deposit accounts located in 25 metropolitan areas in the U.S. We track their outcomes in terms of cash liquidity, profit margin, and exit (see Glossary for definitions) from 2013 to 2017. This panel sample allows us to observe the outcomes of firms with various ages across time in order to characterize the small business sector across cities and determine differences in performance. The cross-sectional sample consists of 760,000 firms that were operating in 2018 in one of 25 metropolitan areas. This sample allows us observe the financial outcomes of firms of all ages in 2018 and aggregate their performance at the ZIP code level.
These samples are based on business deposit accounts and not on employment records, which allow our data to provide insights on the vast majority of small businesses that do not have paid employees. Only 2.5 percent of nonemployers become employers in their first year of operations and the rate of transition to employment declines as they mature (Farrell et al., 2018). While most firms in our sample are nonemployers, they are nevertheless sufficiently formal to have business banking deposit accounts. We do not capture informal businesses that operate only through cash or personal deposit accounts.
Finally, our sample includes firms in ZIP codes that have a sufficiently large number of firms in each of the two samples across the 25 metro areas where we have the highest number of firms in our sample. The selection of 25 metro areas is based on a prior report that characterized the growth and vitality of the overall small business sector (Farrell et al., 2018). Some large metropolitan areas where Chase does not operate branches are absent from our sample.


JPMorgan Chase & Co.'s website terms, privacy and security policies don't apply to the site or app you're about to visit. Please review its website terms, privacy and security policies to see how they apply to you. JPMorgan Chase & Co. isn't responsible for (and doesn't provide) any products, services or content at this third-party site or app, except for products and services that explicitly carry the JPMorgan Chase & Co.